eWatch - A solution to monitor district heating network
Research and Design
Aug 2018 - Jan 2019
The Problem
The purpose of district heating service is to improve the performance of heat network across United Kingdom (UK). The primary goal was to design a service for our product ‘Liberty Connect 100’ smart meter for real-time monitoring of district heat system to ensure proper heating and hot water to consumers at reduced cost. As a UX/UI designer we were responsible to design an interface/dashboard for easy monitoring of the heat network.
My role
1. Gather customer’s insight.
2. Set goals and objectives.
3. Create information architecture and persona.
4. Create wireframes and prototypes.
5. Communicate design ideas and prototypes to developers.
Understanding the problem
I conducted few interactive sessions with Research Analyst and Product Manager to get deep understanding of district heating process. The target users of the service are :
Commissioning Engineer
Operation & Management(O & M)Manager
Energy Manager
The UK's district heating market is underdeveloped, but this is expected to change in the coming years. The government plans to utilize heat networks to meet carbon reduction targets and reduce heating bills for both domestic and commercial consumers as part of its strategic plan. The major challenge was the absence of a monitoring and control system, making it difficult to identify heat losses. To address this, we developed three distinct interfaces tailored for specific user groups mentioned above.
Persona
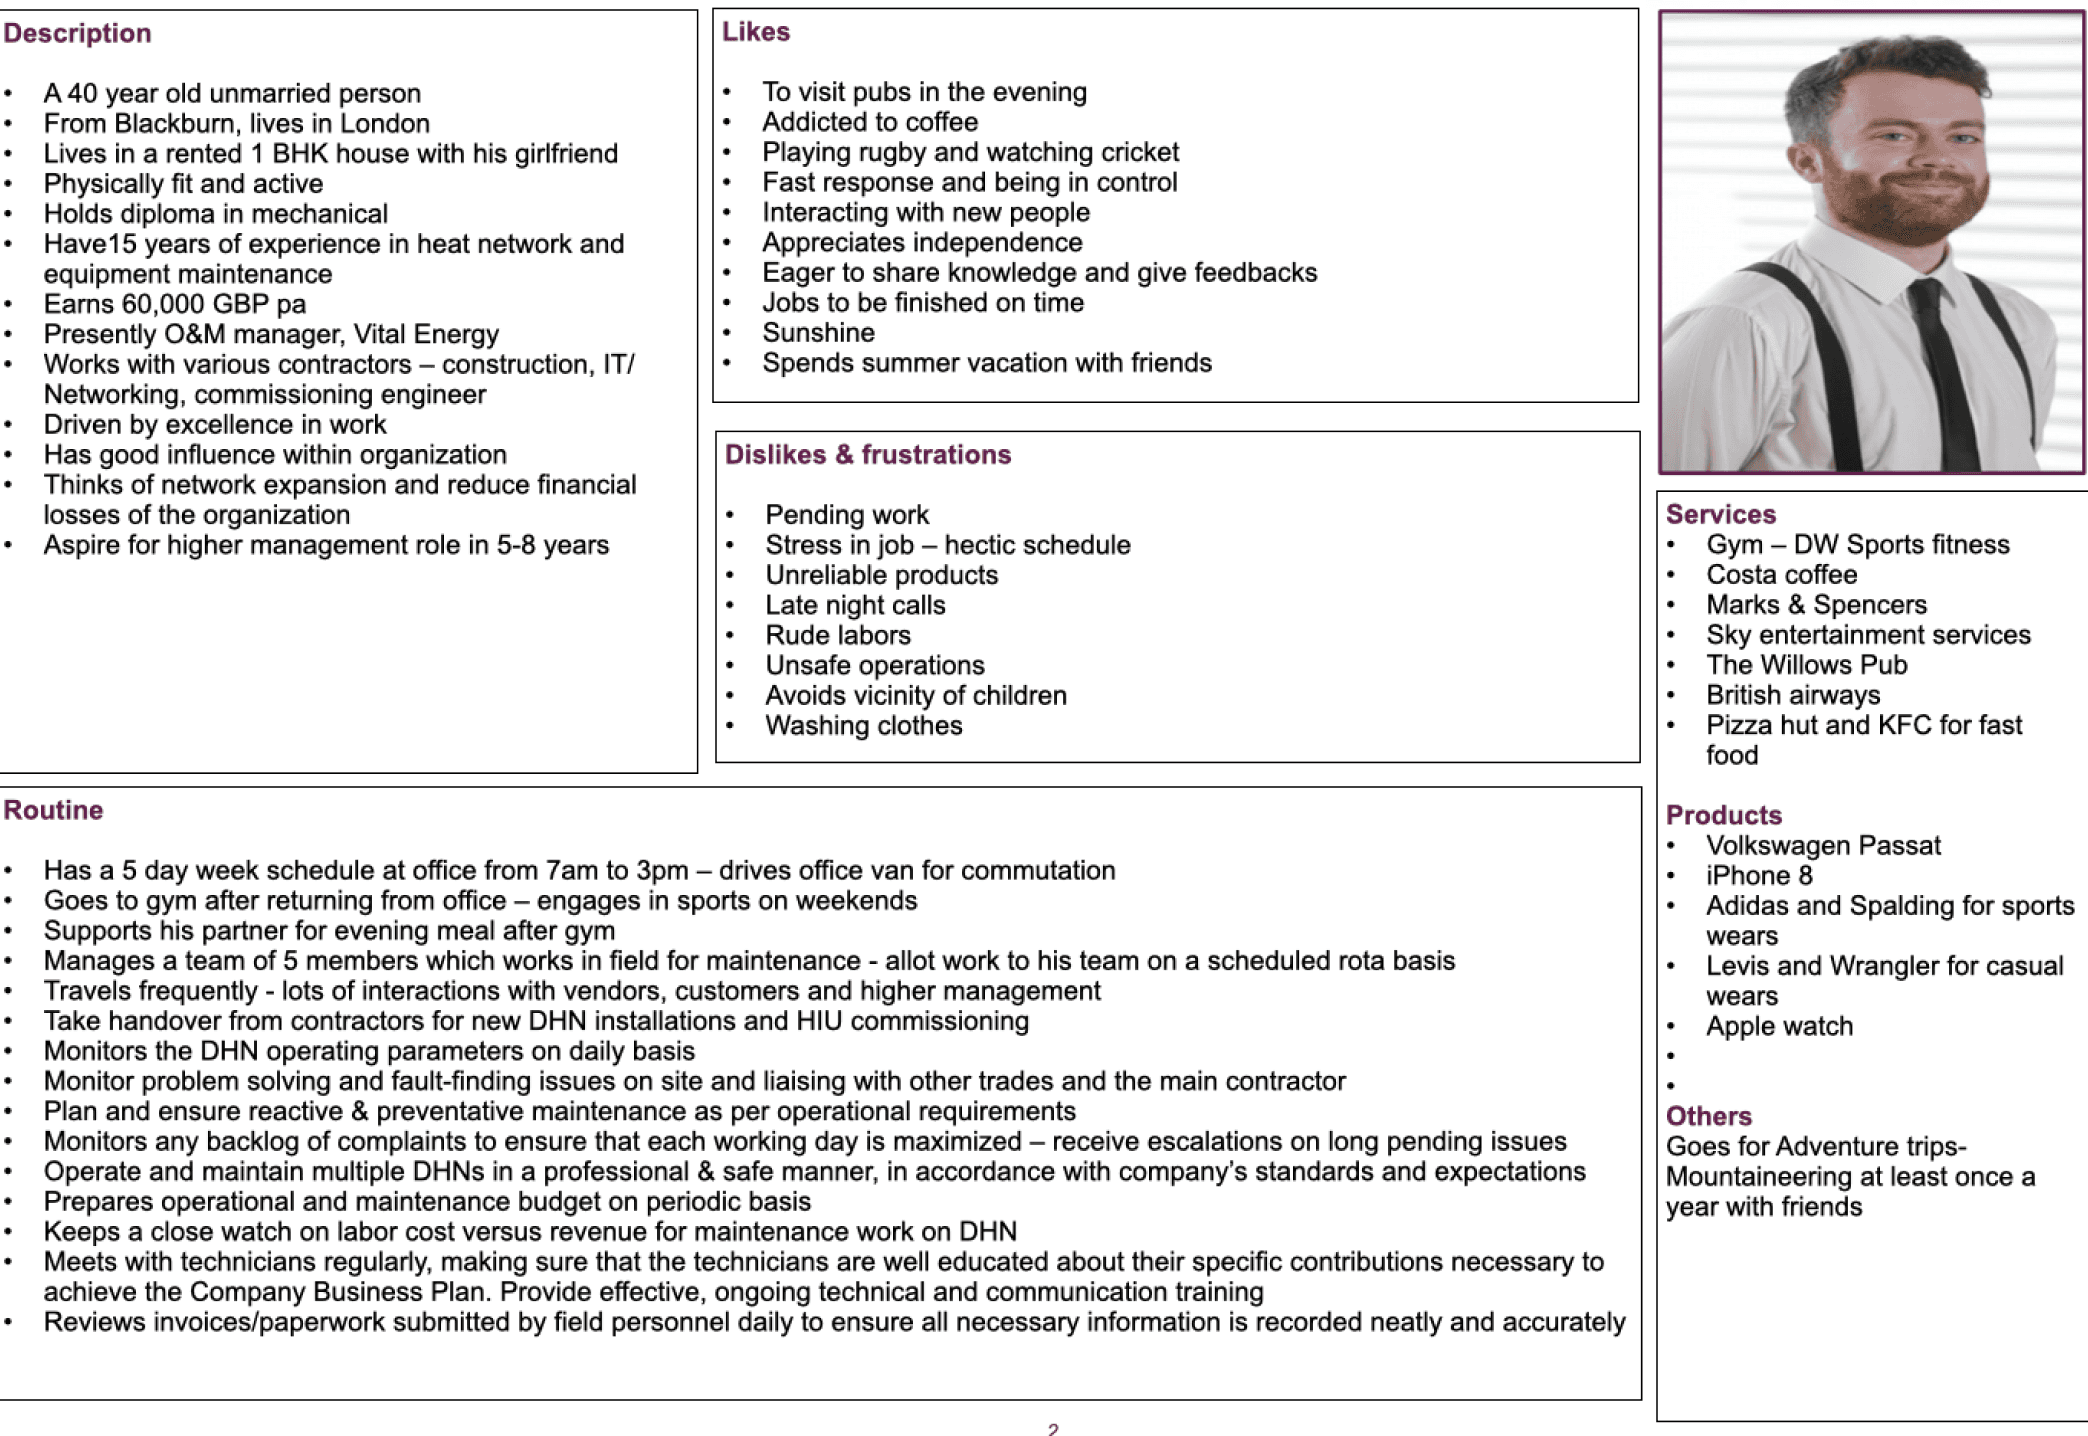
O & M Manager - The role involves regularly monitoring the operating parameters of the District Heating Network (DHN) to ensure efficient performance and reliable service. Additionally, it includes taking over responsibility from contractors for newly installed DHN systems, ensuring a smooth transition and adherence to operational standards.
Commissioning Engineer - The role includes visiting sites to commission Heat Interface Units (HIUs), ensuring they function properly for reliable system operation. It also involves overseeing the timely completion of commissioning and attending sites for servicing or repairs as needed to maintain effective performance.
User flow
I created the userflow to understand when and how the user will interact with the application.
Information architecture - Following the research, we initiated a brainstorming session to come up with the essential features and functionalities for the dashboard. The primary objective was to create an Information Architecture (IA) that would effectively structure and prioritise content to ensure a user-friendly navigation experience.
User flow : For detailed view Click here
Wireframes
High fidelity wireframes - The objective was to create distinct dashboards tailored to the specific needs of three user roles: Commissioning Engineer, Operation & Management (O&M) Manager, and Energy Manager.
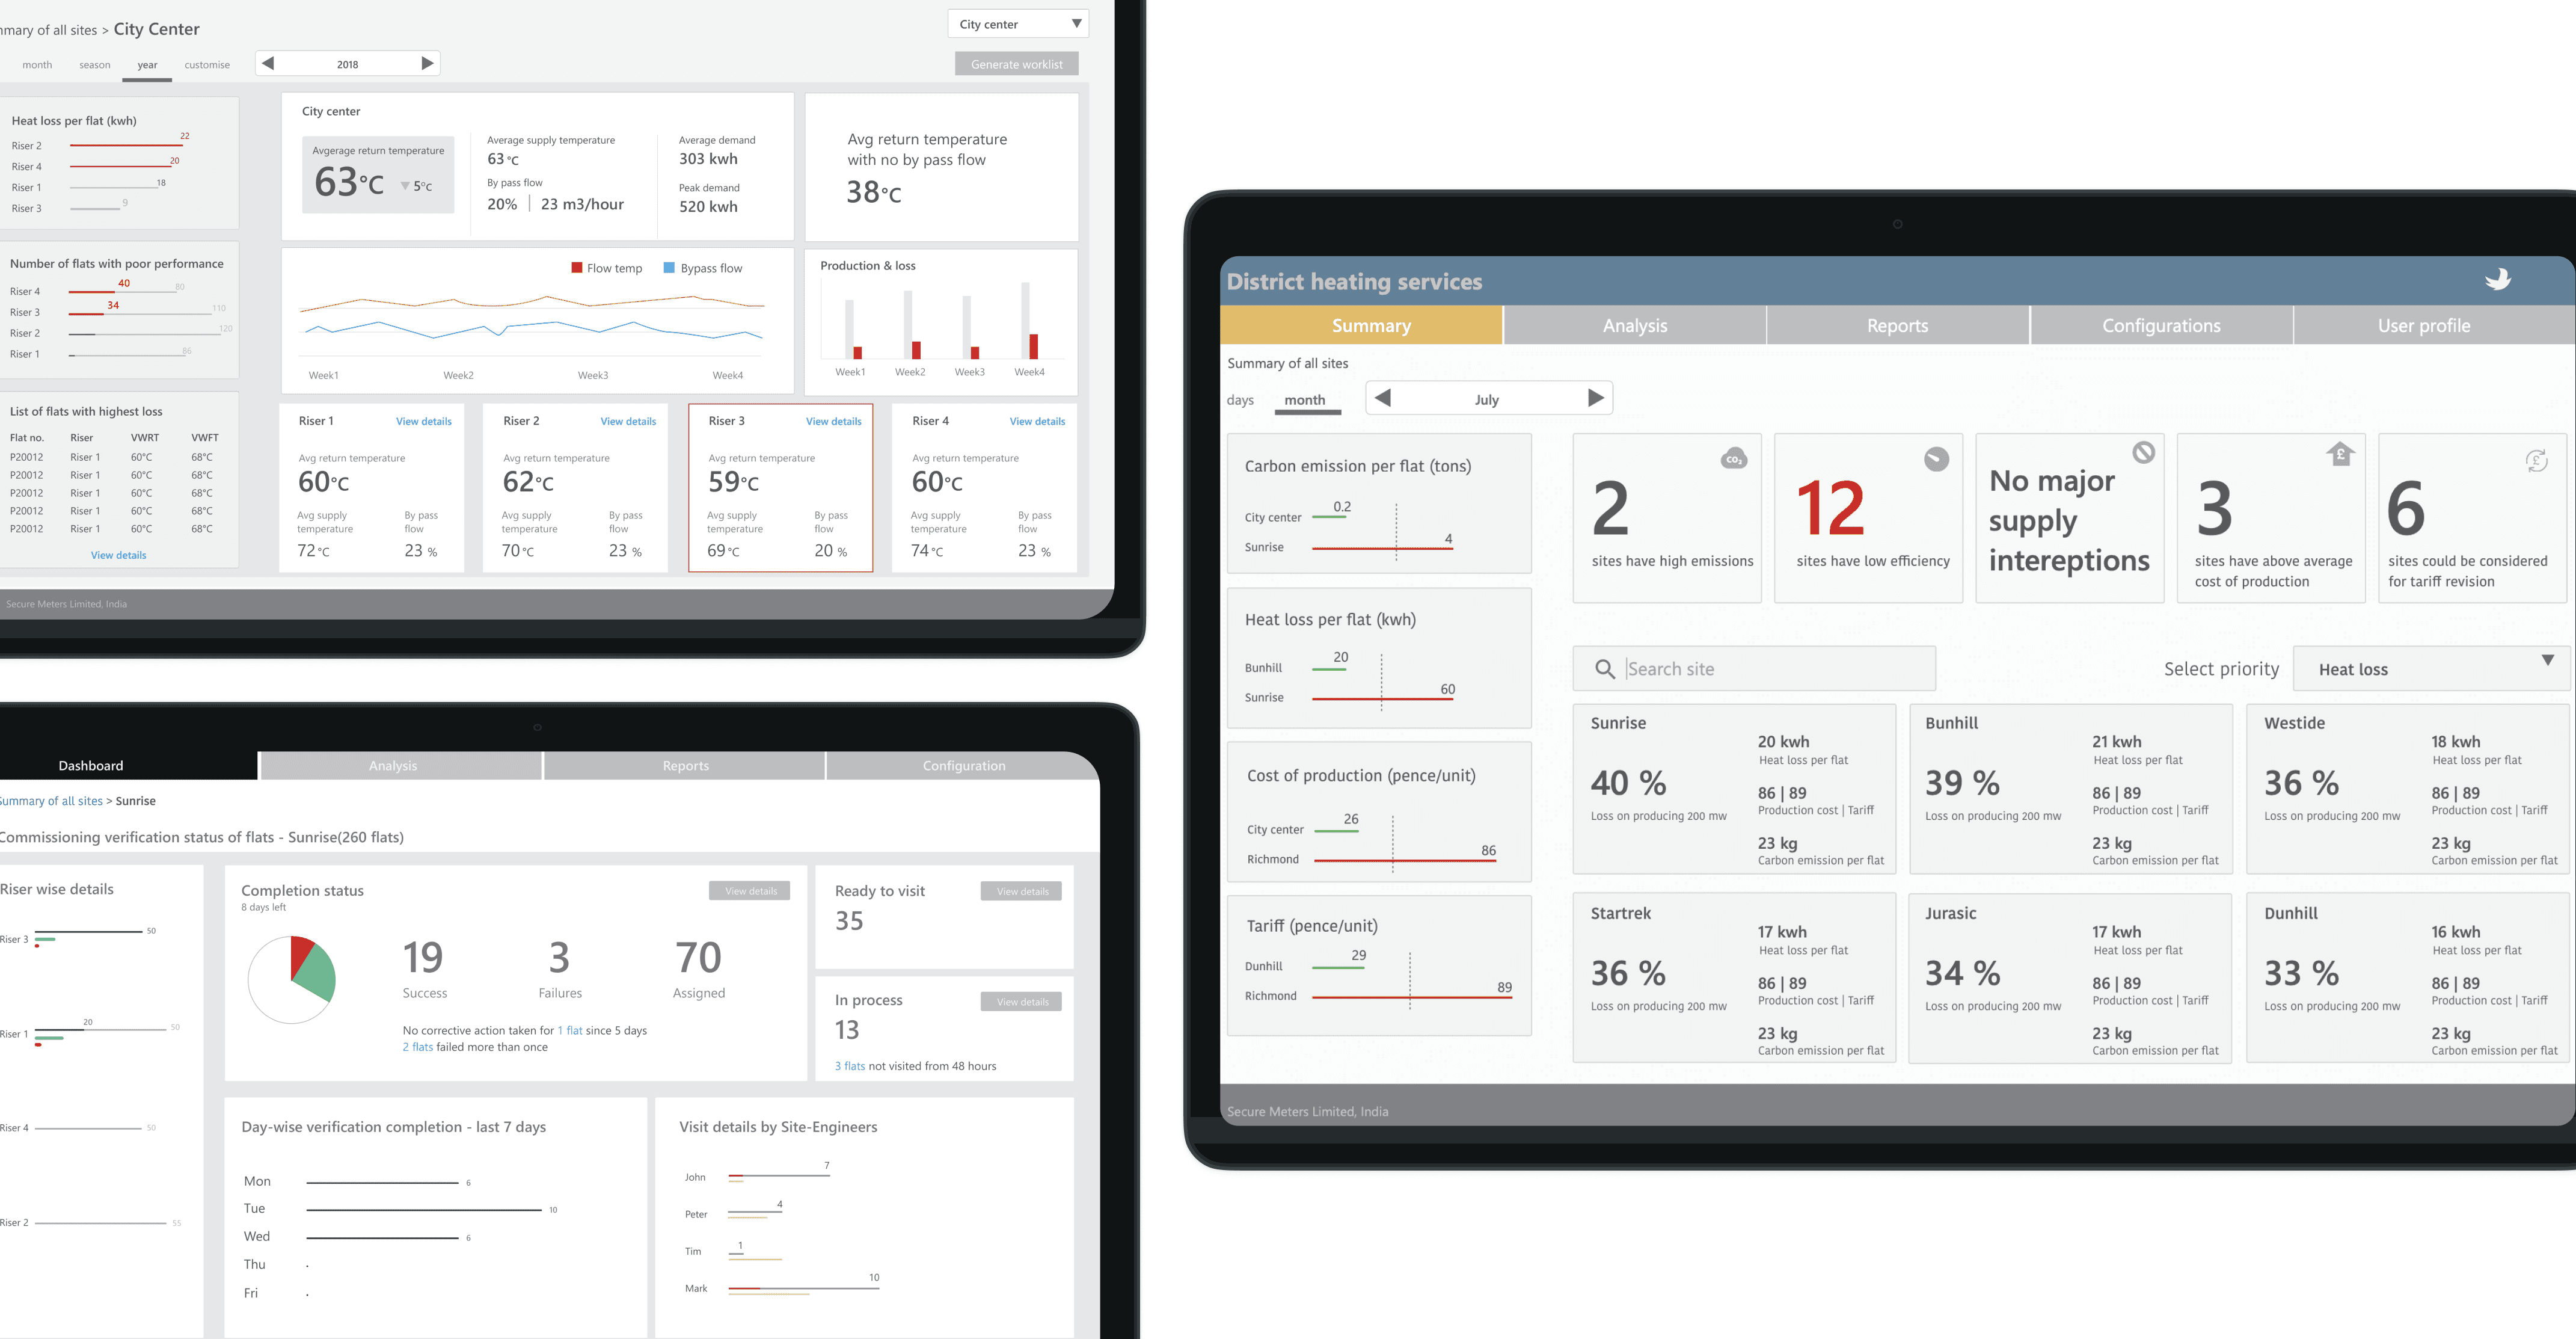
High fidelity wireframes - Operation & Management Dashboard
Provide a comprehensive view of all sites and flats, offering insights into heat loss and highlighting flats with suboptimal performance, enhancing overall user understanding.
Detect and flag anomalous performance across all sites during operation, enabling proactive issue resolution and maintenance, promoting a positive user experience.
Implement visual alerts using a red color scheme, ensuring immediate user attention to areas requiring necessary actions, contributing to a user-friendly interface.
Enhance user experience with customizable dashboard views, allowing users to select dates, whether monthly, yearly, or custom, for a tailored and user-centric analysis.
Operation & Management Dashboard - II
Provide site-wise and flat-wise commissioning status and trends, ensuring timely handover to the operations team.
Deliver status updates and detailed reports on commissioned sites.
Graphically monitor apartments and sites based on various parameters such as reyurn temperature or flow rate.
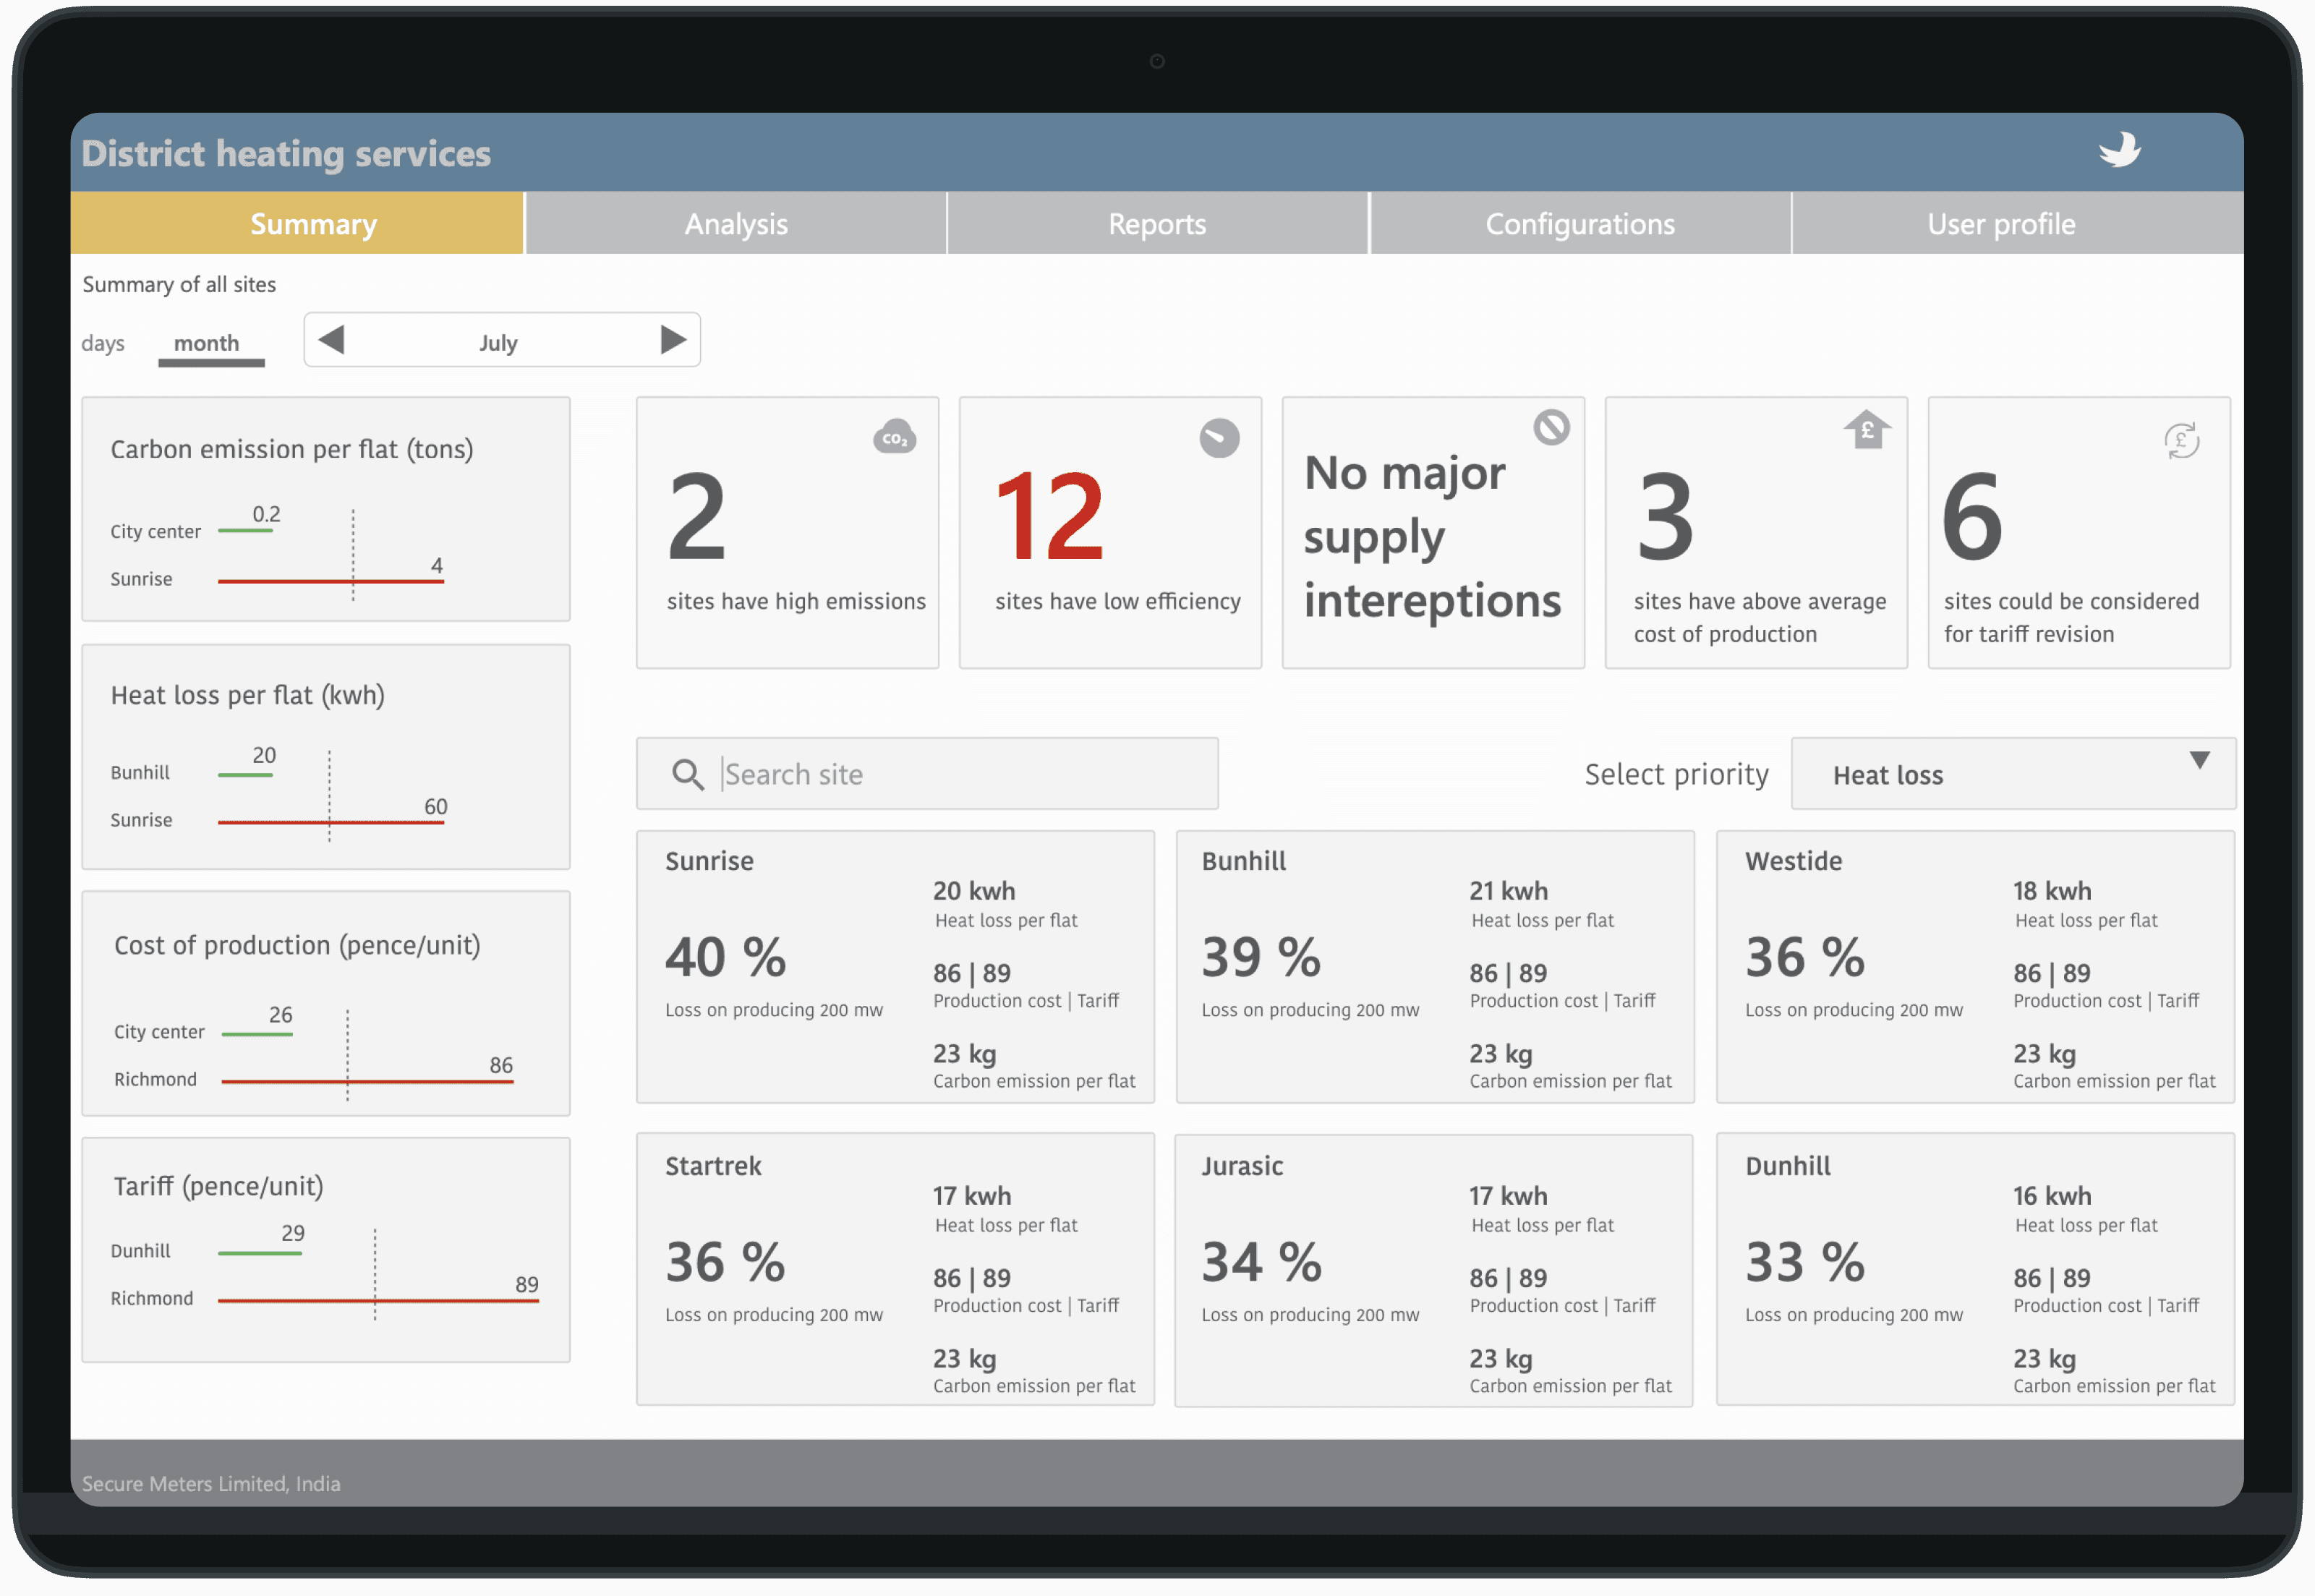
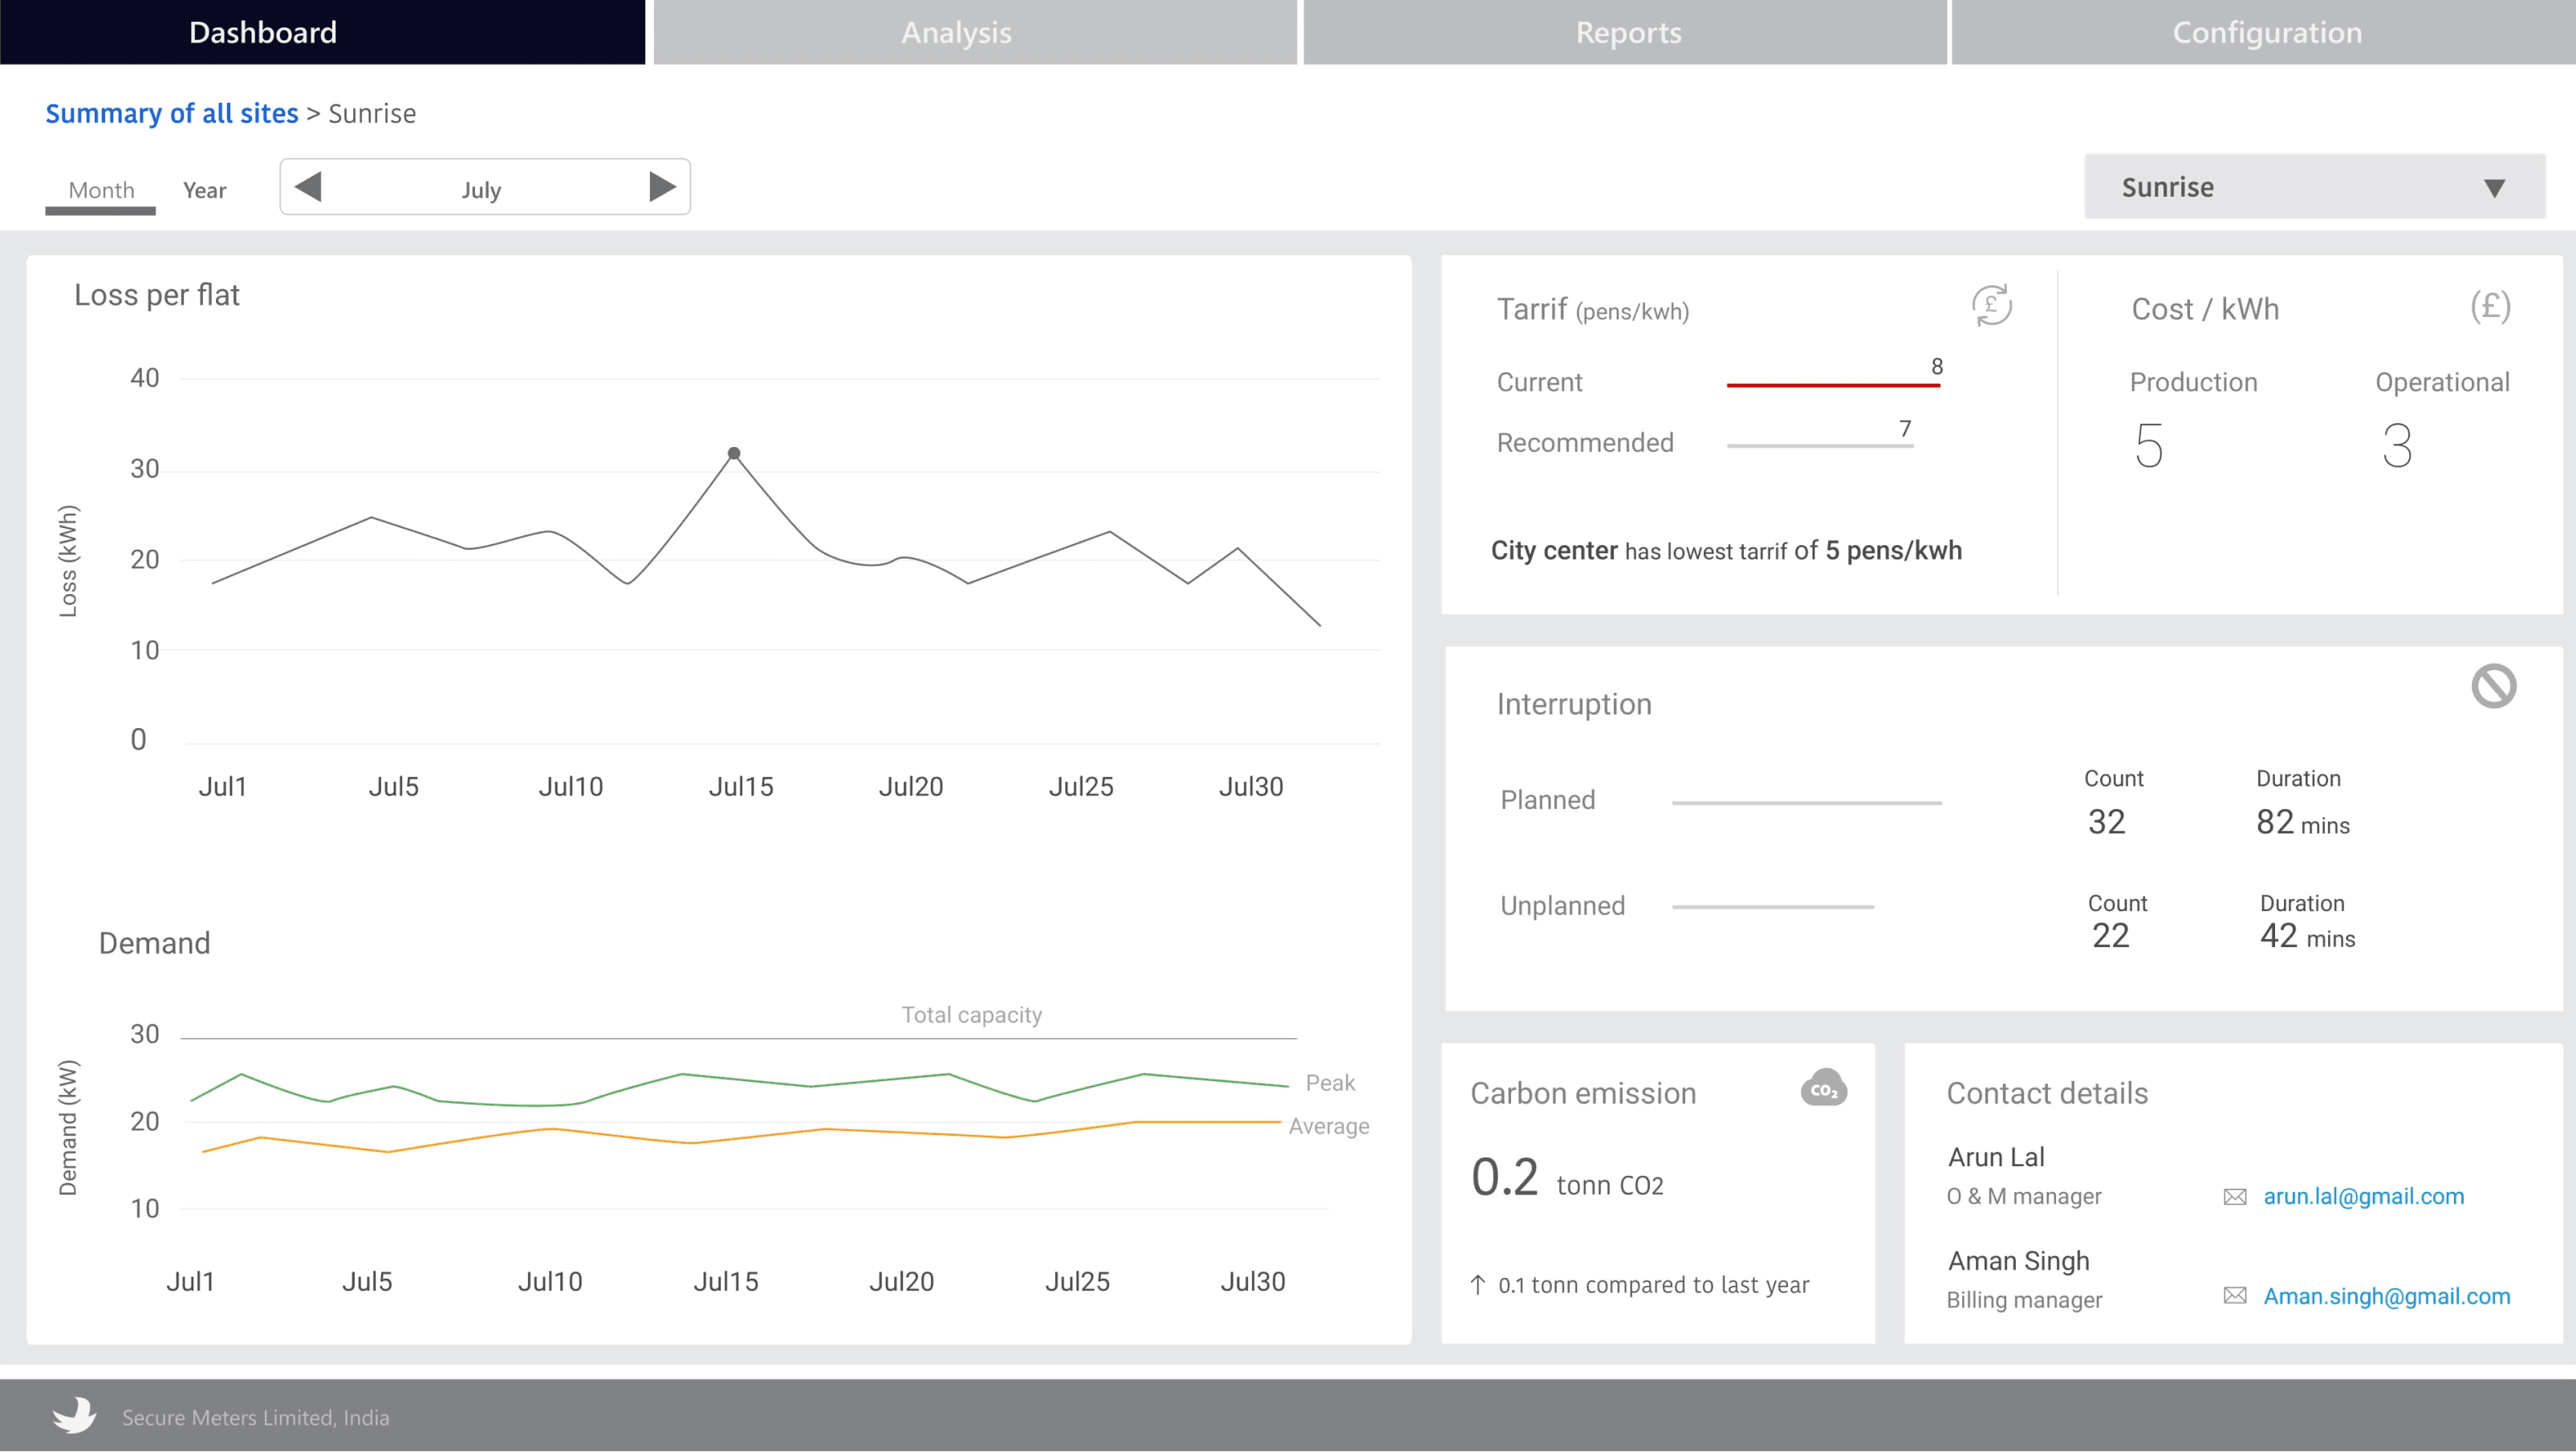
Efficiency Dashboard - I
Monitor energy usage, demand, bypass flows & heat losses so as to find energy saving opportunities.
Monitor, DHN network, heat cost and respective revenue generated on the web dashboard as to reduce inefficiency in system.
Monitor performance of multiple sites together and comparisons within sites on the dashboard.
Carbon saving indicators alerts on the dashboard.
Efficiency Dashboard - II
Displaying periodic trends in graph to compare with any previous period.
Provides insight into energy efficiency of district heat system. User gets the visibility of worst and best site which helps taking necessary action to improve efficiency.
Commissioning Verification
To record and monitor the activity of site engineers, a week-by-week representation of their task allocation is displayed.
The visual depiction with predictable colours attracts the user's attention when urgent action is necessary, while also reducing cognitive burden.
Provides the status of the flats indicating whether commissioning is successful, failed, or currently assigned to the commissioning engineer
Visual Design